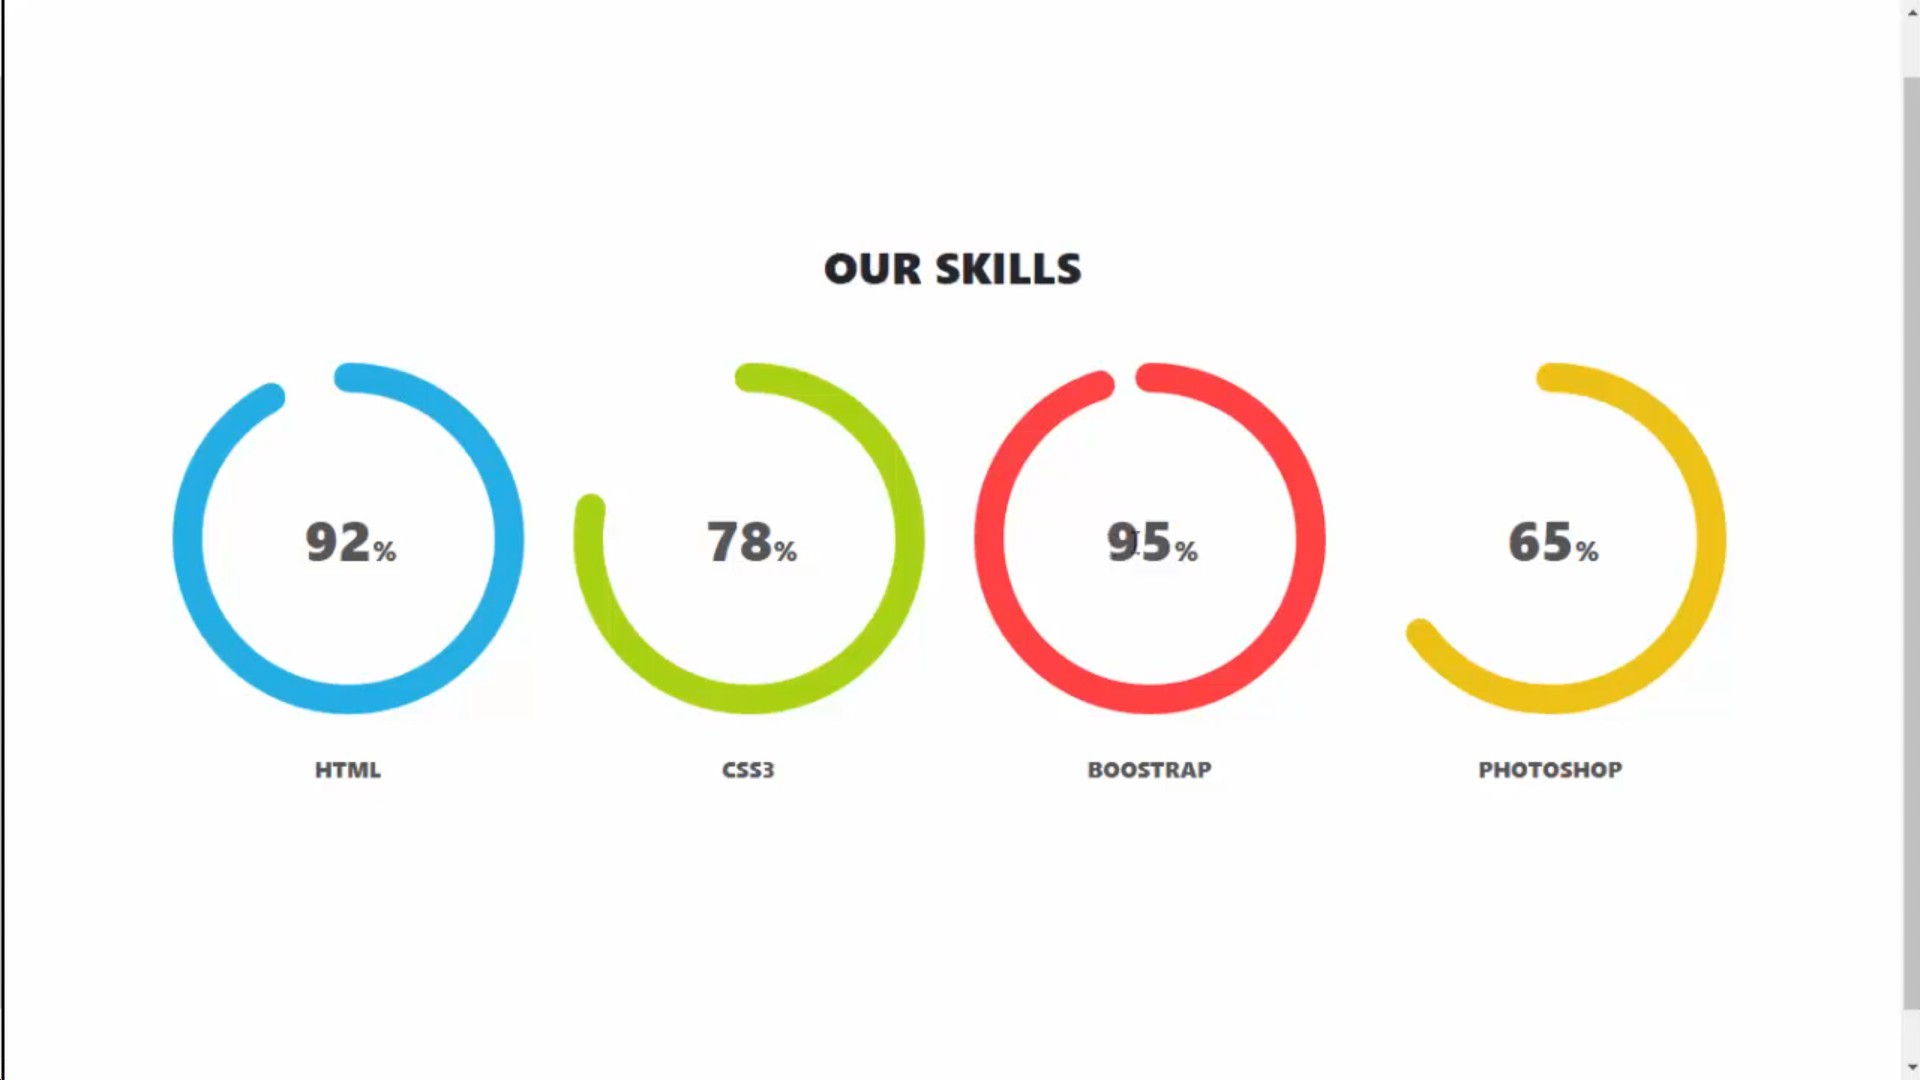
使用 HTML CSS JS 制作动画饼图能力和后台数据展现-cid1073-网站前端设计
 <!doctype html>
<html>
<head>

<title> About</title>
<link href="https://fonts.googleapis.com/css?family=Muli&display=swap" rel="stylesheet">

 <link rel="stylesheet" type="text/css" href="https://stackpath.bootstrapcdn.com/bootstrap/4.4.1/css/bootstrap.min.css">

   <style>


.b-skills
{
  border-top: 1px solid #f9f9f9;
  padding-top: 46px;
  text-align: center;
}

.b-skills:last-child { margin-bottom: -30px; }

.b-skills h2 { margin-bottom: 50px; font-weight: 900; text-transform: uppercase;}

.skill-item
{
  position: relative;
  max-width: 250px;
  width: 100%;
  margin-bottom: 30px;
  color: #555;
}

.chart-container
{
  position: relative;
  width: 100%;
  height: 0;
  padding-top: 100%;
  margin-bottom: 27px;
}

.skill-item .chart,
.skill-item .chart canvas
{
  position: absolute;
  top: 0;
  left: 0;
  width: 100% !important;
  height: 100% !important;
}

.skill-item .chart:before
{
  content: "";
  width: 0;
  height: 100%;
}

.skill-item .chart:before,
.skill-item .percent
{
  display: inline-block;
  vertical-align: middle;
}

.skill-item .percent
{
  position: relative;
  line-height: 1;
  font-size: 40px;
  font-weight: 900;
  z-index: 2;
}

.skill-item  .percent:after
{
  content: attr(data-after);
  font-size: 20px;
}

       p{
           font-weight: 900;
       }


    </style>


</head>

<body>


<br><br><br><br>

    <section id="s-team" class="section">

      <br><br><br>

      <div class="b-skills">
        <div class="container">
          <h2>Our Skills</h2>

          <div class="row">
            <div class="col-xs-12 col-sm-6 col-md-3">
              <div class="skill-item center-block">
                <div class="chart-container">
                  <div class="chart " data-percent="92" data-bar-color="#23afe3">
                    <span class="percent" data-after="%">92</span>
                  </div>
                </div>

                <p>HTML</p>
              </div>
            </div>

            <div class="col-xs-12 col-sm-6 col-md-3">
              <div class="skill-item center-block">
                <div class="chart-container">
                  <div class="chart " data-percent="78" data-bar-color="#a7d212">
                    <span class="percent" data-after="%">78</span>
                  </div>
                </div>

                <p>CSS3</p>
              </div>
            </div>

            <div class="col-xs-12 col-sm-6 col-md-3">
              <div class="skill-item center-block">
                <div class="chart-container">
                  <div class="chart " data-percent="95" data-bar-color="#ff4241">
                    <span class="percent" data-after="%">95</span>
                  </div>
                </div>

                <p>BOOSTRAP</p>
              </div>
            </div>

            <div class="col-xs-12 col-sm-6 col-md-3">
              <div class="skill-item center-block">
                <div class="chart-container">
                  <div class="chart " data-percent="65" data-bar-color="#edc214">
                    <span class="percent" data-after="%">65</span>
                  </div>
                </div>

                <p>PHOTOSHOP</p>
              </div>
            </div>
          </div>
        </div>
      </div>
    </section>
        <br><br><br><br><br>


  <br><br><br><br>


 <script src="plugins/jquery-2.2.4.min.js"></script>
 <script src="plugins/jquery.appear.min.js"></script>
 <script src="plugins/jquery.easypiechart.min.js"></script>
 <script>
    'use strict';

var $window = $(window);

function run()
{
  var fName = arguments[0],
    aArgs = Array.prototype.slice.call(arguments, 1);
  try {
    fName.apply(window, aArgs);
  } catch(err) {

  }
};

/* chart
================================================== */
function _chart ()
{
  $('.b-skills').appear(function() {
    setTimeout(function() {
      $('.chart').easyPieChart({
        easing: 'easeOutElastic',
        delay: 3000,
        barColor: '#369670',
        trackColor: '#fff',
        scaleColor: false,
        lineWidth: 21,
        trackWidth: 21,
        size: 250,
        lineCap: 'round',
        onStep: function(from, to, percent) {
          this.el.children[0].innerHTML = Math.round(percent);
        }
      });
    }, 150);
  });
};


$(document).ready(function() {

  run(_chart);


});


    </script>


</body>

</html>
获取源码: PIECHART
下载数:137人次, 文件大小: 43.5 KB, 上传日期: 2020年-11 月-26日
3,193 人查阅
一键获取本网站前端代码设计的所有源码
获取资源构建和完善自己的源码库
源码可以在本地直接演示
同时研究和体验 如何将一些具体的想法的实现过程
源码可以直接嫁接到自己的网站里复用
稍作修改成为自己的作品
您需要先支付 8元 才能查看此处内容!立即支付


